GIANT SCALE RACING
(Getting Started and Airplane Design)
By: Ed Rankin
Introduction
This is the beginning of articles focused on improving the race model speed. A quick method of determining speed is discussed using propeller pitch and RPM. This can be compared to the model speed using a radar gun or measured by an on-board data recorder.
Determining the geometric characteristics is discussed and how to modify the propeller (if required) for increase or decrease in pitch, or decreased blade area.
A Quick Guideline for Determining Maximum Velocity (Vmax)
Excellent radar guns and in-flight recorders like Aero Sports Engine Data Loggers (EDL) Info@aerosport.org, and Lavara Racing Inflight Real Time Data Recording and Downlink System, RCAT Web, RCAT Systems.com are now available to maximize our model’s speed and minimize the elapsed time on our six lap pylon course by efficiently matching the prop with the engine for the best desired results.
Long and Lengthy equations are available to calculate the maximum speed requiring accurate horsepower available, propeller coefficient, and drag coefficient of the total airplane. Some assumptions must be used in these calculations, but accuracy can be obtained if Reynold’s number corrections are used properly. A quicker way for initial propeller sizing and matching with your engine and model is to use the equation:
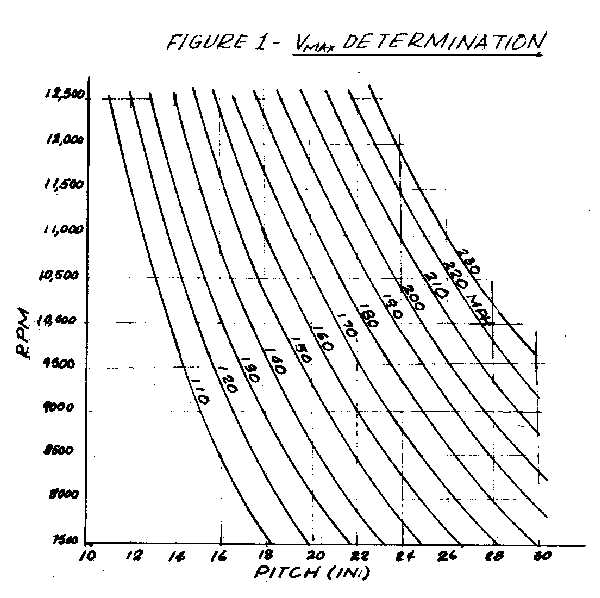
Vmax = E x P x RPM/1056.
Where E = A/P Efficiency (at 0.85%) Prop slippage and A/P drag. P = Prop Pitch (Inches), RPM = Engine Revolutions Per Minute and Vmax = Max speed in level flight.
This equation recognizes that an airplane can travel no faster that the pitch of the propeller times the RPM. This assumes that the model will advance the distance of the pitch every revolution of the propeller. Naturally, there is propeller slippage and airplane drag to consider, which is expressed with the coefficient E. This product is then divided by 1056 to convert the inches and minute units to miles per hour (MPH).
Data from past experience and from other publications give E=0.85 as an average efficiency to use for preliminary calculations. With this in mind several curves of Vmax with E=0.85 were drawn and are shown in Figure 1 for RPM vs. PITCH. RPM is that obtained in the air and pitch is the dynamic pitch. On some propellers the average dynamic pitch (at speed) is different than the geometric (static) pitch. This is caused by the various forces acting on the blade producing both torsional and spanwise deflections. This is dependent on the stiffness of the propeller material. This is the reason why carbon composite or fiberglass is a good propeller material, because these materials can be customized to control stiffness and dynamic deflections.
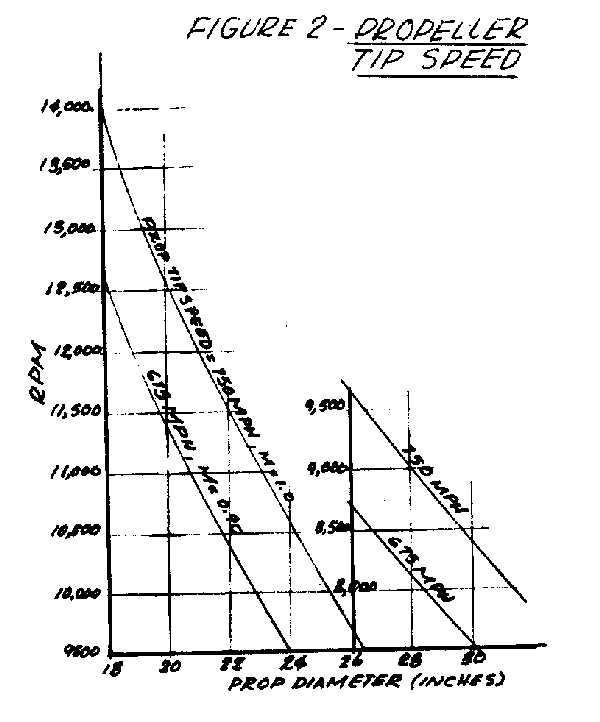
High RPM’s achieved with large diameter propellers is a concern for the modeler in not exceeding the speed of sound at the tips where a severe drag rise along with flutter is experienced. As a rule of thumb, never exceed M (Match) = 0.80 to 0.90 on the propeller tips. Curves for quick reference are shown in Figure 2 with a tip speed of 750 MPH and 675 MPH (m=0.90). Examples for RPM vs. Pitch Curve Usage: P=19, RPM=10,500, S=169 mph. P= 28, RPM=9,000, and S=203mph.
I have been studying propeller aerodynamics lately since I have not used this science since my work on the B-36 in the early 1950’s. After 41 years with General Dynamics (now Lockheed/Martin) as an aeronautical engineer designing airplanes with jet and turbofan engines, it is amazing to me the advancements made in propeller technology. Two of the leaders in scientific solutions to our model airplane propeller designs are Otto Burgdorf of Landing Products (APC) and Stuart L. Sherlock of Western Australia. A short write-up on Propeller Safety Concerns and Designs is reproduced herein with Otto’s consent. Stuart L. Sherlock’s book, Propeller Dynamics, is available from Supercool Racing Propellers, 42 Hepburn Way, Balga, Western Australia (W.A.), Australia 6061, phone/fax 61-2-2472481 props@space.net. These are both technically accurate and refreshing to read and study. I recommend you read them even if you don’t have the technical knowledge to understand them totally because we all need to know how complicated a propeller is to design for optimum performance and how that understanding may benefit us on the race course.
|
|
|
Propeller Safety Concerns
(Excerpts from Article by Otto Burgdorf)
All propellers are inherently dangerous. Model airplane propellers are especially dangerous with those used in high performance racing being extremely dangerous. The warnings about propeller use must be taken seriously, especially for racing applications.
Never assume that a racing propeller blade will not fail, especially when used with state-of-the-art racing engines. Designing a model airplane propeller for stress is uncertain because some major components of propeller loads are very uncertain. The principle load components are: CENTRIFUGAL (from circular motion causing radial load), THRUST/DRAG (from lift and drag acting on blade sections), TORSIONAL ACCELERATION (from engine combustion and/or pre-ignition), and VIBRATION (from resonant frequencies or forced excitation). The large combinations of engines, fuels, temperature, humidity, propeller selections, aircraft performance and pilot practicers creates an endless variety of conditions. Whereas propellers that are used in fairly routine applications such as sport and pattern lend themselves well to test procedures, analytical models, and empirical databases, propellers used must be used with great caution. In summary, please abide by the safety practices recommended by manufacturers. Assume that propellers can fail at any time, especially during full power adjustments on the ground.
NEVER STAND IN OR EXPOSE OTHERS TO THE PLANE OF THE PROPELLER ARC
Calculating Propeller Geometric Characteristics
Sometimes, the Manufacturer stated pitch does not match the actual mean average geometric pitch. Subsequently, the Vmax equation quoted previously will not balance with the measured speed by Radar or on-board data recorder. Therefore, in order to accurately determine the model performance, a comprehensive geometric evaluation of the propeller must be performed. Or you can use the equation to determine the pitch using measured speed and RPM.
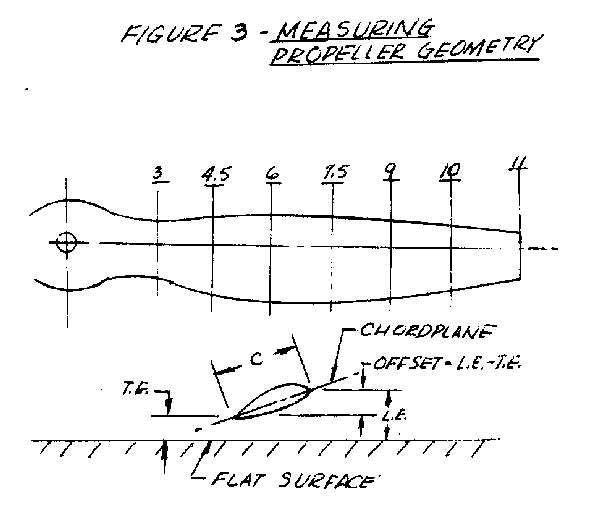
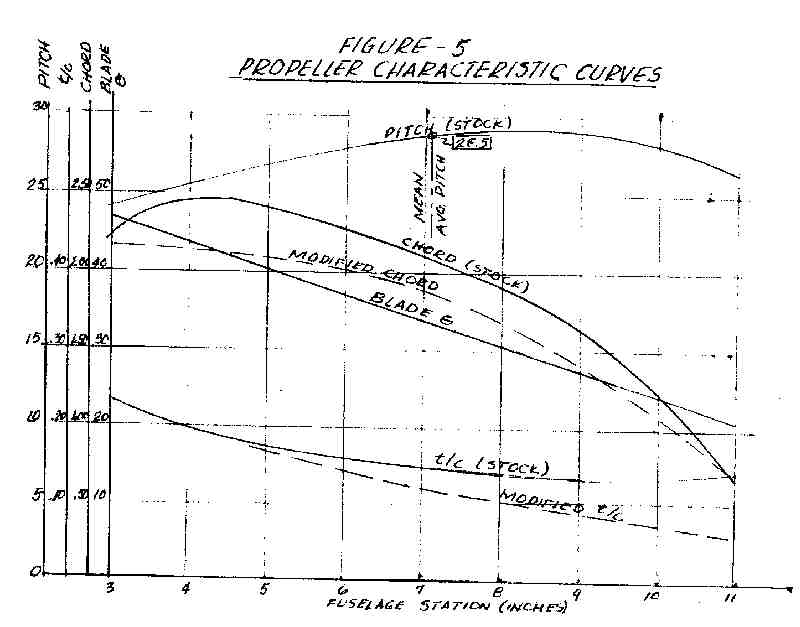
The geometric relationships that will be discussed is the measurement of pitch, blade angle, chord, and thickness ratio. In order to assess the propeller, curves must be plotted of these variables versus blade station (inches from centerline of hole). These curves were developed for a typical Unlimited Class racing prop.
Airfoil/blade shape/ materials
There are many excellent racing propellers for all classes available; both wood and carbon fiber material. Also these props have various airfoil shapes and t/c distributions.
Ö Carbon fiber props are recommended because they are stronger and stiffer than wooden props even covered with carbon fiber cloth. They will allow use of a higher aspect ratio blade without structural failure. Sometimes a properly designed wooden prop will break in the air even with a lower aspec ratio, due to the extreme dynamic loads involved. However, they will retain their geometrical pitch with reduced blade deflection.
Ö Some props use the NACA 64-2xx series airfoil, or a variant with higher camber. I prefer an airfoil with a flat bottom max t/c at 35%, and with sharp L.E. &T.E.
Ö Carbon fiber props are available from Supercool and AeroSport, and can be used with very little or no modifications.
Analyzing Stock Propeller
Ö Use a flat straight surface for all measuring, with a dial caliper depth (See Figure 3) gauge
Ö Place masking tape on the upper surface lengthwise. Mark radius stations in one inch increments starting at the spinner radius. (see Figure 3)
Ö Accurately mark the chord plane at the leading edge and trailing edge
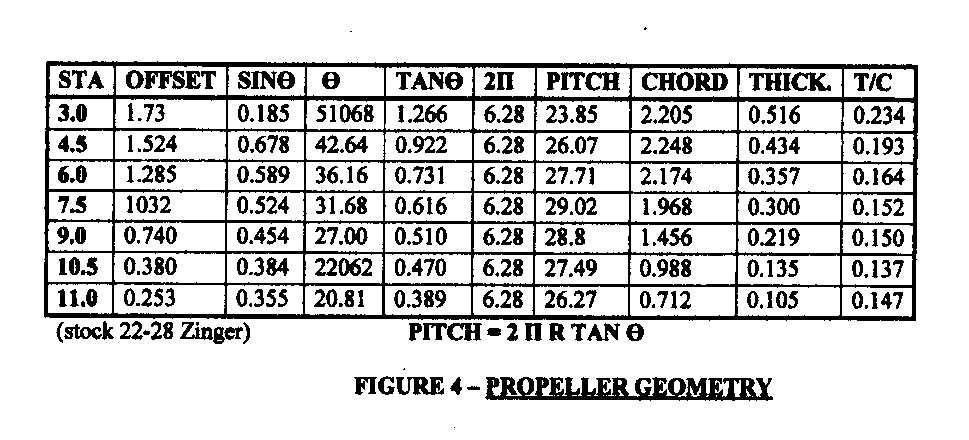
Ö Set-up a table for the measurements as shown in Figure 4
Ö Measure the distance from the flat surface to leading edge, (L.E.), and to the Trailing edge (T.E.), at all stations. Subtract the (T.E.) from the (L.E.) distance resulting in the blade offset (OFF).
Ö Measure the chord station at each station (C)
Ö Calculate the blade angle at each station with the equation: ө=(1/SIN)(OFF)/C(DEGREES)
Ö Calculate the pitch at each station: P=2(pi) R tan ө
Ö Measure the maximum thickness at each station (t).
Ö Calculate the thickness ratio t/c at each station
 |
 |
Ö Use graph paper and plot curves of C, Theta, t/c, and P as shown in Figure 5.
Ö Integrate the pitch curve by using Simpson’s Rule, and calculate the centroid. Locate this centroid and draw an ordinate line. Where this intersects the curve is the value of the Mean Average Pitch. This value is the geometric pitch by which all performance is calculated. Usually this will not match the manufacturer quoted pitch. Also, the pitch distribution, (shape of the curve) may require modifications. The desired shape is: low pitch at the spinner; increasing pitch to the ¾ radius; then decreasing pitch to the tip.
Ö Integrate the chord curve as discussed above and find the area and the centroid. The blade area and the Mean Average Chord is use for performance analysis
Ö Integrate the t/c curve and find the centroid which will be used for performance analysis
Ö The blade angle (Theta) should be drawn first to assure that there are no inflections (discontinuity) in the calculations. Usually, an interation of the dimensional measurements will be required.
Modifying the Prop
Ö Trim the LE and TE on both prop blades accurately for the desired blade area.
Ö Sand the airfoil to shape either with the same thickness (this will increase the t/c which is not desirable); or reduce the thickness ratio and airfoil shape with a desired t/c distribution.
Ö Maintain the original airfoil chord plane for no pitch change
Ö Replot all characteristics
Ö Final sand and balance, and finish
Ö Both of these operations will decrease the blade area
Ö To decrease the pitch trim the trailing edge to a desirable blade shape. Sand the bottom side as shown. The original airfoil can be retained or modified in this stage. Replot curves, final sand, finish, and balance
Ö To increase the pitch trim the leading edge to a desirable blade shape. Sand the bottom of the airfoil as shown. The original airfoil shape can be retained or reshaped in this stage. Replot curves, final sand, finish and rebalance
Helping New Race Pilots
A picture is shown of Jamie Whitbeck’s FIGT80 Shoestring ready for the 2004 Racing season. Jerry Bradley is an example of what experienced pilots need to do to help new pilots to get started. He let him use one half of his shop to build; he built his wing and tails and installed them; he furnished some of the building supplies; loaned him a NIB GT80, and he test flew and checked him out on the airplane.
In Conclusion
These tools can be very useful in determining the model maximum speed and determining the true mean average pitch for propellers so that the true performance can be calculated.
When checking and balancing carbon fiber propellers be sure to “wick” the entire blade with thin C.A. to strengthen the outer surface.
When modifying a wooden prop, use a lower aspect ratio blade to prevent flutter.
Call or e-mail me for any questions or explanations.
Ed E Rankin
(817) 292-0465
rankinred@sbcglobal.net